


Interactive dashboard, with the company figures updated in real time
The central panel gathers the commercial, financial and operational indicators into a single screen: collection against target, the sales trend, leads in progress, overdue invoices and what needs attention today. The charts change when you pick a period, with no page reload, and every user sees strictly the data they are entitled to.
From $2,900 excl. VATone-time payment, no monthly subscription- Included in the core
- Updated without reloading
- Comparison with the previous period
- Actions needed today
- Role-based rights
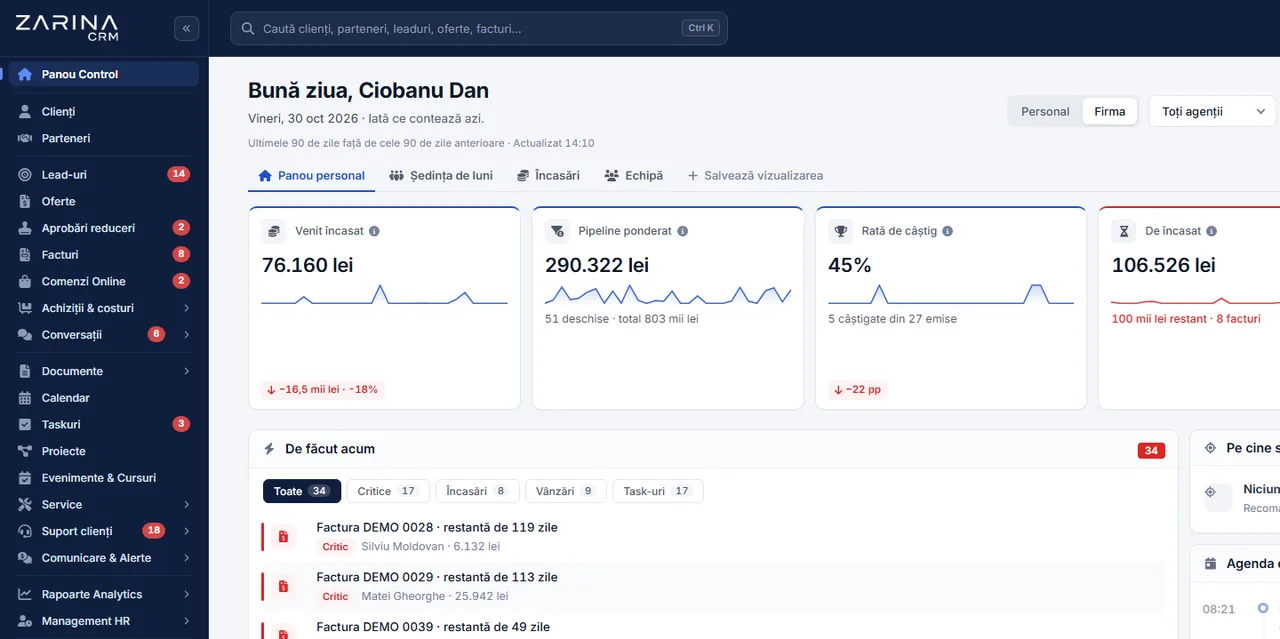
An interactive dashboard with the company figures, up to date. The central panel gathers the commercial, financial and operational indicators into a single screen: collection against target, the sales trend, leads in progress, overdue invoices and what needs attention today. Part of the Zarina CRM core. Permanent licence, installed on the company server and unlimited users.
Works together with: Zarina SMART, Scheduled reports, Budgets and costs.
The current situation, when the figures are put together by hand
The problem is not a lack of data, but the time needed to piece it together and the trust in the result.
- The weekly report is made by hand Someone exports from several places, pastes into spreadsheets and sends a file. Half a day spent on a picture that expires in a few hours.
- Everyone has their own figure Sales report one number, accounting another. The conversation starts with reconciling the sources, not with the decision.
- The problems show up after they have done damage Expired quotations, overdue invoices and missed tasks are discovered when the customer complains or when the money does not come in.
- Nobody knows where the team stands against target With no permanent reference point, the monthly target becomes an end-of-month conversation rather than a management instrument.
- Sensitive data circulates without control A report file reaches the whole team by e-mail, with margins and collection figures not everyone should see.
- The comparison with the previous period is missing A figure on its own says nothing. With no reference, a good month cannot be told from a weak one.
What the central panel contains
The panel is part of the application core. It is not bought separately and it is available from day one.
Indicators with a trend
Every figure has a reference, it does not stand alone.
- Sales, collection, leads, invoices
- Compared with the equivalent previous period
- The percentage change shown
- A selectable period
Interactive charts
Changing the period does not reload the page.
- Updated in the background, instantly
- An interval of 7, 15, 30 days or custom
- The trend by day and by month
- Comparison between periods
Progress against the financial target
The target becomes a permanent reference point.
- A progress bar on actual collection
- Fed from the paid invoices
- A configurable target
- Visible to the roles entitled to it
Actions needed today
The panel flags what cannot wait.
- Quotations expiring in a few days
- Tasks past their deadline
- Invoices past their due date
- Direct access to the record
The team activity, as a stream
What happened in the last hours, in order.
- New leads received
- Quotes issued and accepted
- Invoices and payments
- Activity per user
A company-wide or a personal view
The same screen, two levels of reading.
- A company-wide view for management
- A personal view for consultants
- A switch for the roles entitled to it
- No separate reports to maintain
What changes in the first two weeks
Direct effects of the company picture being available permanently rather than on request.
The meeting starts from the figures
A report is no longer prepared for every discussion.
- The same picture for everyone
- No files to merge
- No reconciliation at the start of the meeting
- A conversation about decisions, not about data
Problems caught on the day they appear
The list of required actions replaces the manual checks.
- Quotations close to expiry
- Overdue invoices
- Tasks past their deadline
- One click to the record
The target becomes tracked
The team always knows where it stands.
- Progress on actual collection
- Visible daily
- No manual calculations
- A reference for end-of-month decisions
Administrative time recovered
The reporting hours go back into selling.
- No exporting and processing
- No weekly report to compile
- Always current data
- Export only when it is needed
Decisions based on comparison
The figure has context, so it means something.
- The equivalent previous period
- The percentage change
- Visible trends
- Observable seasonality
Data seen only by those who should
Transparency does not mean access to everything.
- Margins and collection limited by role
- Consultants see their own portfolio
- Management sees the company level
- No files circulated by e-mail
How it works, concretely
The panel reads data from the same database the team works in. There is no second system to feed.
- 1
The data comes from the current activity
Every quotation issued, invoice collected and lead created feeds the indicators automatically. There is no separate entry for reporting.
- 2
The period changes without a reload
When another interval is chosen, the charts are recalculated in the background and the screen is rewritten instantly, without loading the page again.
- 3
The comparison uses an equal interval
For the last 15 days, the system compares with the 15 days before. That way the percentage change means something, instead of comparing unequal periods.
- 4
Heavy statistics are kept in memory
Querying thousands of invoices on every click would slow the application down. The aggregated results are kept for a few minutes, then recalculated.
- 5
The view changes with the role
An administrator switches between the company picture and the personal one. A consultant stays on their own view, with no switch available.
- 6
The action list is rebuilt continuously
The deadlines are checked in the background: quotations close to expiry, overdue tasks and invoices past due appear with no intervention.
Interactive dashboard, in short, inside the application
The indicators that matter in the Monday meeting
A panel with forty figures does not get read. The selection is what makes it useful.
Collection against target
The single figure that says whether the month is going well.
- Money actually collected, not invoiced
- Progress against target
- Remaining to target
- Comparison with the previous month
Pipeline in progress
What comes next, not only what has happened.
- Value of quotations under review
- Leads by stage
- Conversion rate
- Quotations close to expiry
Arrears and due dates
The money that exists on paper, but not in the account.
- Invoices past their due date
- Days overdue
- Total receivable
- Direct access to the invoice
Team activity
The real workload, not the impression.
- Activity per user
- Completed tasks
- Quotations issued
- Comparison between periods
Who sees what, in the central panel
A panel that shows everything to everyone becomes a problem. Visibility follows the role structure.
- Management sees the company level The administrator and the commercial manager have the global view: the whole team, all collections, all margins.
- The consultant sees their own portfolio The personal view shows the user’s leads, quotations and activity, without their colleagues’ figures.
- Margins and profit are restricted A sales role does not query the company margins. The restriction applies at data level, not only at display level.
- Teams follow the hierarchy A coordinator sees the team they lead, within the configured limits, not the whole company.
- Exports follow the same rules What cannot be seen in the panel cannot be exported. There is no way around it through reporting.
- Everything stays on your own server The indicators are calculated on your installation. There is no data transfer to an external service.
What runs automatically in the dashboard module
The panel needs no maintenance: it feeds itself from day-to-day activity.
Automatic recalculation
The figures are not updated by hand.
- Fed from current activity
- Recalculation when the period changes
- No data import
- No parallel reporting
Deadline flagging
What is about to expire is visible beforehand.
- Quotations close to expiry
- Invoices due
- Overdue tasks
- No manual checks
Scheduled reports
The picture reaches the people who do not log in every day too.
- Periodic report by email
- Configurable recipients
- Export attached
- Through the scheduled reports module
In-app notifications
Important events are not lost.
- Notification on configured events
- Counters in the menu
- A sound for new events
- Configurable per user
Export on demand
The data can leave, under control.
- Export by period
- It respects the user’s rights
- Format for analysis
- Recorded in the application
Works on any screen
The panel can be read from a phone as well.
- Adaptive layout
- No separate app
- The same permissions
- Useful while travelling
How the data in the panel is protected
Aggregated indicators are the most sensitive information in the application, because they show the whole company on one screen.
- Checks at data level The restrictions are applied at query time, not by hiding elements in the interface.
- The personal view cannot be bypassed A user without the right to the global view does not obtain the company figures through any other route in the application either.
- Targets and margins have their own permissions Configuring targets and access to margins are granted separately, to finance and management roles.
- No uncontrolled copies The panel replaces the report files sent by email, which used to stay on personal devices.
- Data on the company server The calculation is done locally, on your own installation. There is no transmission to an external provider.
- Operations stay on record Exports and significant accesses are written to the application log.
What needs to be prepared so the dashboard module is useful from day one
The panel works immediately after installation, but its value depends on a few decisions.
The company targets
Without a benchmark, progress means nothing.
- Collection target per period
- Optionally, per team
- Revisable at any time
- Set at implementation
The role structure
It decides what each person sees.
- Roles and teams configured
- A company-wide or a personal view
- Access to margins
- Reviewable later
The historical data, if it exists
Comparisons need history.
- Import of invoices and customers
- The period taken over
- A check before saving
- Agreed at implementation
Scheduled tasks on the server
For flags and reports.
- Active scheduled task
- Configurable interval
- Diagnostics on failure
- Checked during implementation
Discipline in recording
The board shows what is recorded.
- Quotations issued from the application
- Invoices and collections recorded
- Tasks with a deadline
- Rules agreed internally
The indicators you track
Few and relevant.
- What is actually discussed in the meeting
- What drives decisions
- No decorative indicators
- Agreed together
The limits of the panel, stated explicitly
The central panel is a tool for running the business day to day, not an advanced analytics system.
- It is not a business intelligence tool For complex multidimensional analysis, the data export to your own analysis tool is used.
- It does not produce official financial statements The figures are operational, for management. Statutory reporting stays with accounting.
- It does not display what is not recorded A sale written down on paper does not appear in the panel. The quality of the picture depends on the discipline of recording.
- Heavy statistics have a delay of a few minutes Aggregated results are kept temporarily, for speed. A collection registered just now may enter the chart with a slight delay.
- It does not replace detailed reports For lists, filters and record-level detail there is the reports and statistics module.
- Comparisons need history In the first month of use, percentage changes have no reference. They become useful once there is data for earlier periods.
When this module makes sense and when it does not
We prefer to say from the start in which situations the module is not worth its cost, so the sales conversation does not begin with the wrong expectations.
It makes sense if
The situations in which the module pays for itself quickly.
- Management asks for the current position and somebody compiles it by hand
- The indicators are currently calculated in spreadsheets
- You want every role to see the figures that concern it
- The data already exists in the platform, but it is not seen together
It does not make sense if
The situations in which we recommend not buying it now.
- You track a single indicator, checked daily
- The data is not yet entered in the platform consistently
- You use a reporting tool you prefer
- Decisions are taken without figures and will stay that way
How the central panel is licensed
The panel is part of the mandatory core, so it is included in every configuration.
Included in the core
It is not bought separately and is available in all packages.
What the core includes
Users and roles, clients and contacts, leads and the sales pipeline, custom fields and 15 interface languages.
Together with reports
For detailed lists and export, the reports and statistics module is used.
Pricing and configurations
Package composition and prices by edition are on the pricing page.
Companies that have trusted Zarina CRM


Interactive dashboard: what it costs and what you get
You pay once. Everything that follows is written here, not in hidden conditions.
Included in the Zarina CRM core — $2,320 excl. VAT, one-time payment. The core is part of every tier below, so the function is available in any configuration.
Cheaper in a bundle. The tiers group several packages at a price lower than their sum:
- Start2 packages + core$2,900−19%
$3,570 - Pro5 packages + core$3,480−34%
$5,280 - Business8 packages + core$4,640−38%
$7,460 - Enterprise13 packages + core$6,970−31%
$10,080
List prices, excl. VAT, one-time payment, unlimited users. The struck-through price is the sum of the packages bought individually. Current offers apply on the pricing page.
What you pay over time for a subscription CRM
Over 3 years, the subscription costs $10,480; the Zarina Start licence costs $2,900, once.
An indicative comparison: enter the subscription price you pay now. The licence does not grow with the number of users.
What you get
- A lifetime licence, with no subscription and no per-user charge
- Unlimited users, on the same licence
- 6 months of warranty on correct operation: fixing errors and inconsistencies
- Implementation, configuration and team training, included in the price
- The licence is verified locally, on your own server: the application does not depend on our servers to work
How long it takes and what is needed
- 48 hours in the standard configuration; up to 14 working days with customisation around the company’s workflow
- Your own server or web hosting with cPanel, with an SSL certificate
- PHP 7.4 or newer (8.x recommended) and MySQL / MariaDB
- The PHP extensions mysqli, json, mbstring; curl, gd and zip for integrations, PDF and exports
- One cron task, for reminders and automations
Where data lives
- The data stays on your server and does not pass through ours
- Roles and rights per user, two-factor authentication
- An audit trail and limits on login attempts
- Consents and data subject requests, managed in the application
- Digitally signed updates and backups from the application
Questions about the central panel in the CRM
Do I have to reload the page to see the updated charts?
What does the global view mean compared with the personal one?
Do sales consultants see the company profit and collections?
How are the percentage changes calculated?
What goes into the progress bar against target?
How is the list of required actions put together?
Why does a collection recorded just now not appear in the chart instantly?
Can the time intervals shown be changed?
Does the panel look good on a phone?
Does it replace detailed reports?
Get the complete product sheet by email
A six-page document with everything you need to know before a sales conversation. No obligation and no sales call.
- The platform core and the 13 module packages, with what each one contains
- The features and modules of the edition you choose, plus available integrations
- Full pricing and what it includes: installation, training, data import, warranty
- The native integrations available and the situations where the platform is not a good fit
Take control of your operations, once
We install Zarina CRM on your hosting, configure it around your own workflow and train your team. From that moment on, the application is an asset of your company, not a recurring expense.